
About this analysis
![]()
This data briefing from think thank Win Climate evaluates how NY HEAT would impact energy affordability for residents of Brooklyn.
It is based on a larger report from NY Renews and Win Climate, NY HEAT is a Win for Energy Affordability.
About NY HEAT
New York State is currently considering the NY HEAT Act (S2016/A4592), an ambitious piece of legislation that would pave the way for the state’s buildings to transition from fossil fueled to electric heating.
NY HEAT Act also aims to alleviate New York’s energy affordability crisis: the bill creates a goal for the state to ensure no household pays more than 6% of their annual income on gas and electric bills.1
1 See §5 of the NY HEAT Act (NYS Legislature 2024).
How would this cap on residential energy bills affect energy burdens in Brooklyn?
How many Brooklyn residents are highly energy burdened today?
- Energy burden
- The percentage of a household’s income spent on home energy bills.
2 Why are energy burdens above 6% considered “high”? According to affordability researchers, households shouldn’t pay more than 30% of their income on housing, or 20% of those costs on energy. (30% x 20% = 6%)
About 1 in 4 (24%) Brooklyn residents have a high energy burden: they pay more than 6% of their annual income on electricity, natural gas, and delivered fossil fuels.2
How much money would residents save?
If NY HEAT were enacted, the 24% of Brooklyn households with high energy burdens could see their bills cut in half, saving an average of $140 per month.
How do burdens and savings vary across Brooklyn?
Different areas of Brooklyn are more energy burdened, and would enjoy greater savings, than others:

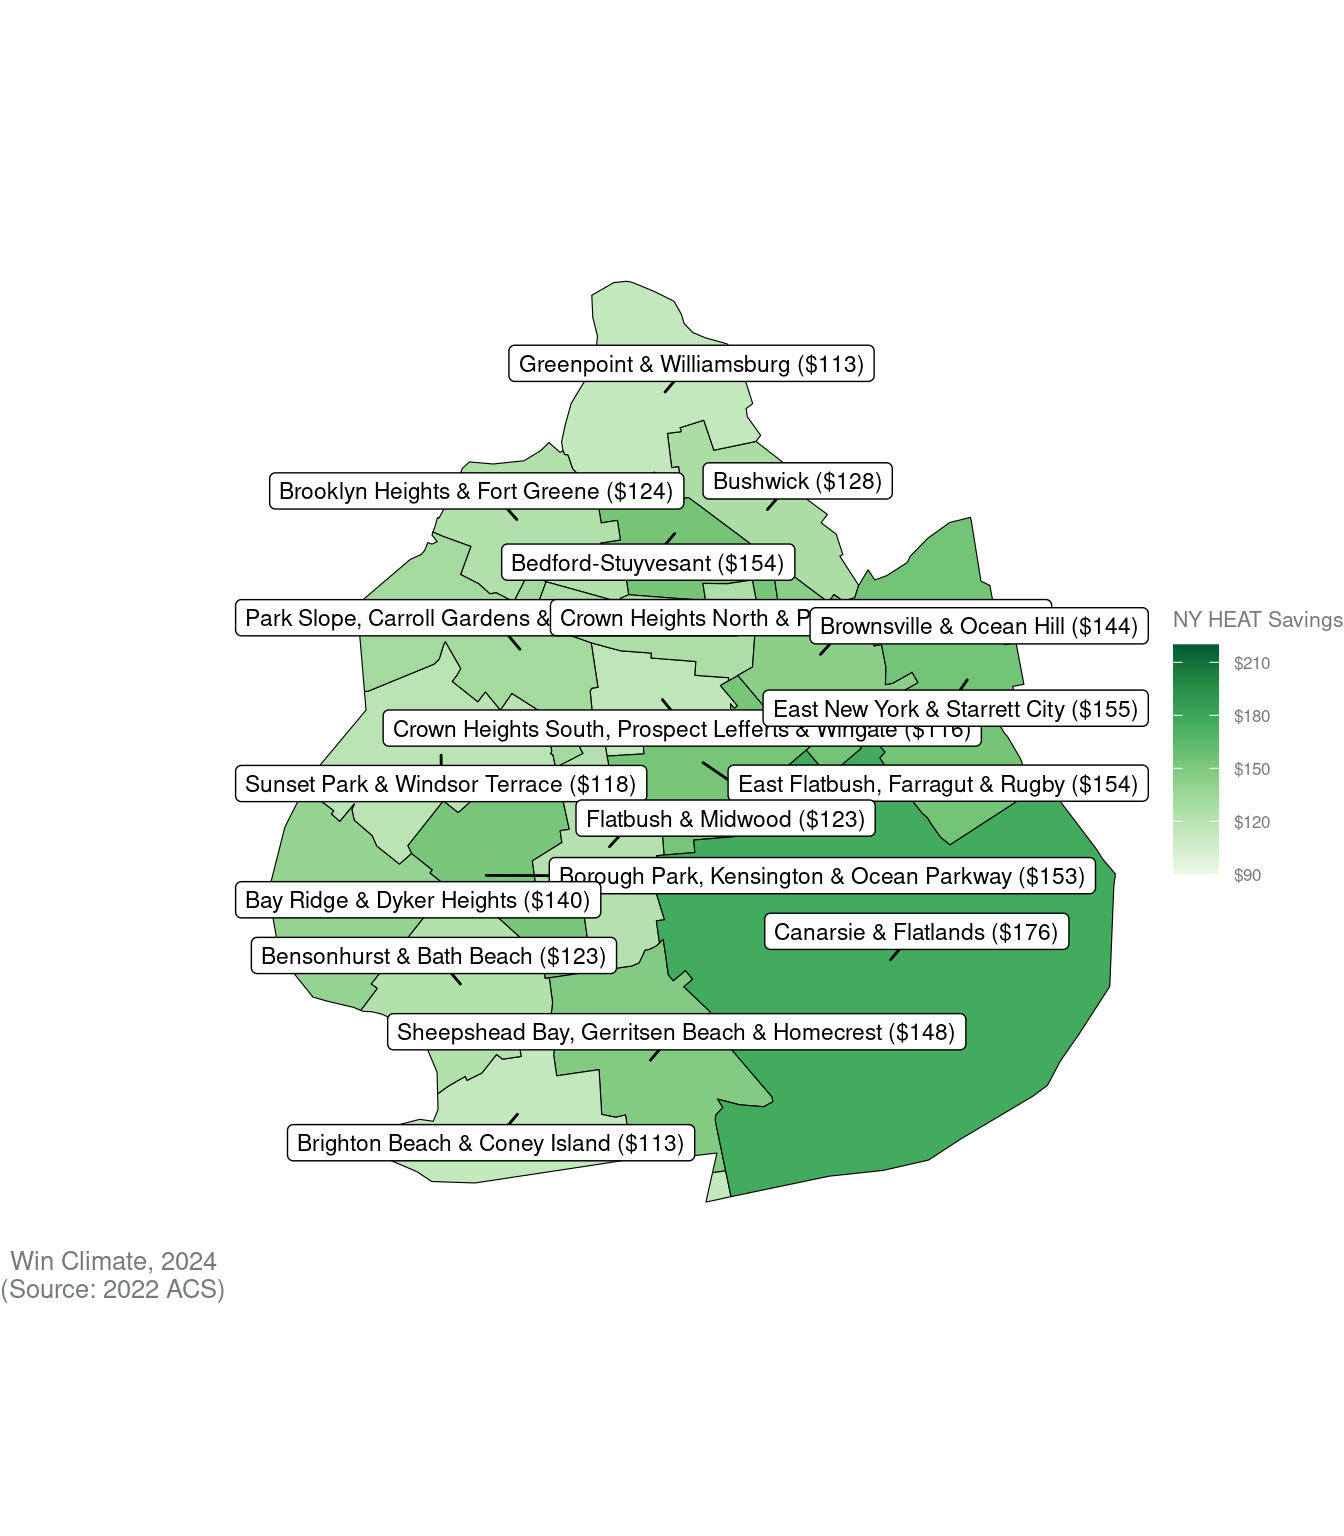
The following table contains a complete breakdown of our findings:
| Region | Homes with high energy burdens (%) | Avg. monthly energy bills of high-burden homes | Avg. monthly savings for high-burden homes under NY HEAT |
|---|---|---|---|
| Total | |||
| Brooklyn | 24% | $287 | $140 |
| Area | |||
| Community District 4--Bushwick | 23% | $254 | $128 |
| Community District 11--Bensonhurst & Bath Beach | 28% | $256 | $123 |
| Community District 16--Brownsville & Ocean Hill | 35% | $249 | $144 |
| Community District 10--Bay Ridge & Dyker Heights | 21% | $279 | $140 |
| Community District 1--Greenpoint & Williamsburg | 18% | $230 | $113 |
| Community District 18--Canarsie & Flatlands | 27% | $385 | $176 |
| Community District 14--Flatbush & Midwood | 22% | $265 | $123 |
| Community District 2--Brooklyn Heights & Fort Greene | 12% | $306 | $124 |
| Community District 6--Park Slope, Carroll Gardens & Red Hook | 10% | $304 | $132 |
| Community District 3--Bedford-Stuyvesant | 25% | $315 | $154 |
| Community District 9--Crown Heights South, Prospect Lefferts & Wingate | 23% | $241 | $116 |
| Community District 8--Crown Heights North & Prospect Heights | 19% | $267 | $127 |
| Community District 17--East Flatbush, Farragut & Rugby | 33% | $310 | $154 |
| Community District 5--East New York & Starrett City | 30% | $324 | $155 |
| Community District 12--Borough Park, Kensington & Ocean Parkway | 36% | $304 | $153 |
| Community District 15--Sheepshead Bay, Gerritsen Beach & Homecrest | 29% | $313 | $148 |
| Community District 13--Brighton Beach & Coney Island | 28% | $223 | $113 |
| Community District 7--Sunset Park & Windsor Terrace | 23% | $245 | $118 |
| Excluding households with utility bills in rent, or missing fuel or income information. Source: 2022 ACS. Win Climate, 2024 | |||
About NY Renews
NY Renews is a coalition of over 370 environmental, justice, faith, labor, and community groups, and the force behind NY’s Climate Act.
NY HEAT is part of the coalition’s 2024 Climate Jobs and Justice Package.
Find out more at nyrenews.org/cjjp.
![]()
About Win Climate
![]()
Win Climate is a think tank that provides legislators and advocates with rigorous and actionable data on state climate policy.
Our team of data scientists and policy experts brings evidence-based insight to climate and energy issues.
Find out more at climate.win.
Acknowledgements
The authors would like to thank Laurie Wheelock and the staff of the Public Utility Law Project (PULP) for their helpful discussion of energy affordability calculation methods.
Data & Methods
To understand how much money Brooklyn residents are spending on energy, we turned to the American Community Survey (ACS) 3, the flagship yearly survey from the US Census.
3 Specifically, these variables from the 2022 PUMS dataset (U.S. Census Bureau 2022)
- Energy burdens: For all of the households in a County, we estimated their yearly energy bill costs (combining electricity, natural gas, heating oil and propane), and calculated which households spent more than 6% of their annual income. To ensure we’re comparing apples-to-apples, we excluded any households whose bills are included in their rent, and any with missing income or utility data.
- Savings under NY HEAT: We identified households that spent more than 6% of their income on electricity and natural gas. For homes heated by delivered fuels, we selected households that spent more than 6% of their income on electricity alone. We then calculated the savings that would result if the bills of these two populations shrunk to 6%.
Assumptions
Our analysis rests on the following assumptions:
- Self-reported energy bills: our data on energy bill costs comes the American Community Survey, where it is self-reported by households. We assume that this data accurately reflects—on average—what households are paying for electricity, natural gas, and delivered fuels in Brooklyn.
- Low-income energy affordability programs: we assume that these self-reported energy bills reflect any bill reductions households are already receiving by being enrolled in low-income energy affordability programs such as the federal Heating Energy Assistance Program (HEAP) and the state Energy Affordability Program (EAP). Under this assumption, our analysis estimates the number of households that are still energy burdened after factoring in these payments.
- Delivered fuels: NY HEAT’s 6% affordability provision does not apply to delivered fuels like heating oil or propane. While we factor fuel delivery payments in our energy burden calculation, we do not factor them in to our savings calculation: in our model, households receive no assistance with delivered fuel bills. Further, in order to receive assistance on their electric bills, households on delivered fuels must pay more than 6% of their income on electricity alone.
- This is why our results suggest that NY HEAT would not completely eliminate energy burdened households in New York State.
- We believe this assumption reflects how the NY Public Service Commission (PSC) would likely implement NY HEAT.
References
Reuse
Citation
@online{shron2024,
  author = {Shron, Max and Velez, Juan-Pablo},
  title = {NY {HEAT} and {Energy} {Affordability} in {Brooklyn}},
  date = {2024-03-08},
  url = {pub.climate.win/nyheat/brooklyn/index.html},
  langid = {en}
}